
For those students who are participating in the branding competition but have no idea what a case study might be like heres the best place to get them.
Brand Management Case Studies
There are other case studies there, all of which are related to marketing (Sales, Public Relations, etc.). Click the appropriate links on the sidebar to get them
Wednesday, April 16, 2008
GE / McKinsey Matrix
GE / McKinsey Matrix
High | |||||
Medium | |||||
Low | |||||
The GE / McKinsey matrix is similar to the BCG growth-share matrix in that it maps strategic business units on a grid of the industry and the SBU's position in the industry. The GE matrix however, attempts to improve upon the BCG matrix in the following two ways:
The GE matrix generalizes the axes as "Industry Attractiveness" and "Business Unit Strength" whereas the BCG matrix uses the market growth rate as a proxy for industry attractiveness and relative market share as a proxy for the strength of the business unit.
The GE matrix has nine cells vs. four cells in the BCG matrix.
Industry attractiveness and business unit strength are calculated by first identifying criteria for each, determining the value of each parameter in the criteria, and multiplying that value by a weighting factor. The result is a quantitative measure of industry attractiveness and the business unit's relative performance in that industry.
Industry Attractiveness
The vertical axis of the GE / McKinsey matrix is industry attractiveness, which is determined by factors such as the following:
- Market growth rate
- Market size
- Demand variability
- Industry profitability
- Industry rivalry
- Global opportunities
- Macroenvironmental factors (PEST)
Each factor is assigned a weighting that is appropriate for the industry. The industry attractiveness then is calculated as follows:
| Industry attractiveness = | factor value1 x factor weighting1 | |
| + | factor value2 x factor weighting2 | |
| . . . | ||
| + | factor valueN x factor weightingN |
Business Unit Strength
The horizontal axis of the GE / McKinsey matrix is the strength of the business unit. Some factors that can be used to determine business unit strength include:
- Market share
- Growth in market share
- Brand equity
- Distribution channel access
- Production capacity
- Profit margins relative to competitors
The business unit strength index can be calculated by multiplying the estimated value of each factor by the factor's weighting, as done for industry attractiveness.
Plotting the Information
Each business unit can be portrayed as a circle plotted on the matrix, with the information conveyed as follows:
- Market size is represented by the size of the circle.
- Market share is shown by using the circle as a pie chart.
- The expected future position of the circle is portrayed by means of an arrow.
The following is an example of such a representation:

The shading of the above circle indicates a 38% market share for the strategic business unit. The arrow in the upward left direction indicates that the business unit is projected to gain strength relative to competitors, and that the business unit is in an industry that is projected to become more attractive. The tip of the arrow indicates the future position of the center point of the circle.
Strategic Implications
Resource allocation recommendations can be made to grow, hold, or harvest a strategic business unit based on its position on the matrix as follows:
Grow strong business units in attractive industries, average business units in attractive industries, and strong business units in average industries.
Hold average businesses in average industries, strong businesses in weak industries, and weak business in attractive industies.
Harvest weak business units in unattractive industries, average business units in unattractive industries, and weak business units in average industries.
There are strategy variations within these three groups. For example, within the harvest group the firm would be inclined to quickly divest itself of a weak business in an unattractive industry, whereas it might perform a phased harvest of an average business unit in the same industry.
While the GE business screen represents an improvement over the more simple BCG growth-share matrix, it still presents a somewhat limited view by not considering interactions among the business units and by neglecting to address the core competencies leading to value creation. Rather than serving as the primary tool for resource allocation, portfolio matrices are better suited to displaying a quick synopsis of the strategic business units.
BCG Growth-Share Matrix
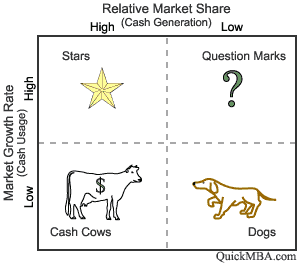
Resources are allocated to business units according to where they are situated on the grid as follows:
Cash Cow - a business unit that has a large market share in a mature, slow growing industry. Cash cows require little investment and generate cash that can be used to invest in other business units.
Star - a business unit that has a large market share in a fast growing industry. Stars may generate cash, but because the market is growing rapidly they require investment to maintain their lead. If successful, a star will become a cash cow when its industry matures.
Question Mark (or Problem Child) - a business unit that has a small market share in a high growth market. These business units require resources to grow market share, but whether they will succeed and become stars is unknown.
Dog - a business unit that has a small market share in a mature industry. A dog may not require substantial cash, but it ties up capital that could better be deployed elsewhere. Unless a dog has some other strategic purpose, it should be liquidated if there is little prospect for it to gain market share.
The BCG matrix provides a framework for allocating resources among different business units and allows one to compare many business units at a glance. However, the approach has received some negative criticism for the following reasons:
The link between market share and profitability is questionable since increasing market share can be very expensive.
The approach may overemphasize high growth, since it ignores the potential of declining markets.
The model considers market growth rate to be a given. In practice the firm may be able to grow the market.
These issues are addressed by the GE / McKinsey Matrix, which considers market growth rate to be only one of many factors that make an industry attractive, and which considers relative market share to be only one of many factors describing the competitive strength of the business unit.
PEST Analysis
A scan of the external macro-environment in which the firm operates can be expressed in terms of the following factors:
- Political
- Economic
- Social
- Technological
The acronym PEST (or sometimes rearranged as "STEP") is used to describe a framework for the analysis of these macroenvironmental factors. A PEST analysis fits into an overall environmental scan as shown in the following diagram:
| ||||||||||||||||||||||||
Political Factors
Political factors include government regulations and legal issues and define both formal and informal rules under which the firm must operate. Some examples include:
- tax policy
- employment laws
- environmental regulations
- trade restrictions and tariffs
- political stability
Economic Factors
Economic factors affect the purchasing power of potential customers and the firm's cost of capital. The following are examples of factors in the macroeconomy:
- economic growth
- interest rates
- exchange rates
- inflation rate
Social Factors
Social factors include the demographic and cultural aspects of the external macroenvironment. These factors affect customer needs and the size of potential markets. Some social factors include:
- health consciousness
- population growth rate
- age distribution
- career attitudes
- emphasis on safety
Technological Factors
Technological factors can lower barriers to entry, reduce minimum efficient production levels, and influence outsourcing decisions. Some technological factors include:
- R&D activity
- automation
- technology incentives
- rate of technological change
External Opportunities and Threats
The PEST factors combined with external microenvironmental factors can be classified as opportunities and threats in a SWOT analysis.
Friday, April 11, 2008
Porter's Generic Strategies
If the primary determinant of a firm's profitability is the attractiveness of the industry in which it operates, an important secondary determinant is its position within that industry. Even though an industry may have below-average profitability, a firm that is optimally positioned can generate superior returns.
Porter's Generic Strategies
Cost Leadership StrategyGeneric Strategies and Industry Forces
A firm positions itself by leveraging its strengths. Michael Porter has argued that a firm's strengths ultimately fall into one of two headings: cost advantage and differentiation. By applying these strengths in either a broad or narrow scope, three generic strategies result: cost leadership, differentiation, and focus. These strategies are applied at the business unit level. They are called generic strategies because they are not firm or industry dependent. The following table illustrates Porter's generic strategies:
| Target Scope | Advantage | |
| Low Cost | Product Uniqueness | |
Broad (Industry Wide) | Cost Leadership Strategy | Differentiation Strategy |
Narrow (Market Segment) | Focus Strategy (low cost) | Focus Strategy (differentiation) |
Cost Leadership Strategy
This generic strategy calls for being the low cost producer in an industry for a given level of quality. The firm sells its products either at average industry prices to earn a profit higher than that of rivals, or below the average industry prices to gain market share. In the event of a price war, the firm can maintain some profitability while the competition suffers losses. Even without a price war, as the industry matures and prices decline, the firms that can produce more cheaply will remain profitable for a longer period of time. The cost leadership strategy usually targets a broad market.
Some of the ways that firms acquire cost advantages are by improving process efficiencies, gaining unique access to a large source of lower cost materials, making optimal outsourcing and vertical integration decisions, or avoiding some costs altogether. If competing firms are unable to lower their costs by a similar amount, the firm may be able to sustain a competitive advantage based on cost leadership.
Firms that succeed in cost leadership often have the following internal strengths:
Access to the capital required to make a significant investment in production assets; this investment represents a barrier to entry that many firms may not overcome.
Skill in designing products for efficient manufacturing, for example, having a small component count to shorten the assembly process.
High level of expertise in manufacturing process engineering.
Efficient distribution channels.
Each generic strategy has its risks, including the low-cost strategy. For example, other firms may be able to lower their costs as well. As technology improves, the competition may be able to leapfrog the production capabilities, thus eliminating the competitive advantage. Additionally, several firms following a focus strategy and targeting various narrow markets may be able to achieve an even lower cost within their segments and as a group gain significant market share.
Differentiation Strategy
A differentiation strategy calls for the development of a product or service that offers unique attributes that are valued by customers and that customers perceive to be better than or different from the products of the competition. The value added by the uniqueness of the product may allow the firm to charge a premium price for it. The firm hopes that the higher price will more than cover the extra costs incurred in offering the unique product. Because of the product's unique attributes, if suppliers increase their prices the firm may be able to pass along the costs to its customers who cannot find substitute products easily.
Firms that succeed in a differentiation strategy often have the following internal strengths:
Access to leading scientific research.
Highly skilled and creative product development team.
Strong sales team with the ability to successfully communicate the perceived strengths of the product.
Corporate reputation for quality and innovation.
The risks associated with a differentiation strategy include imitation by competitors and changes in customer tastes. Additionally, various firms pursuing focus strategies may be able to achieve even greater differentiation in their market segments.
Focus Strategy
The focus strategy concentrates on a narrow segment and within that segment attempts to achieve either a cost advantage or differentiation. The premise is that the needs of the group can be better serviced by focusing entirely on it. A firm using a focus strategy often enjoys a high degree of customer loyalty, and this entrenched loyalty discourages other firms from competing directly.
Because of their narrow market focus, firms pursuing a focus strategy have lower volumes and therefore less bargaining power with their suppliers. However, firms pursuing a differentiation-focused strategy may be able to pass higher costs on to customers since close substitute products do not exist.
Firms that succeed in a focus strategy are able to tailor a broad range of product development strengths to a relatively narrow market segment that they know very well.
Some risks of focus strategies include imitation and changes in the target segments. Furthermore, it may be fairly easy for a broad-market cost leader to adapt its product in order to compete directly. Finally, other focusers may be able to carve out sub-segments that they can serve even better.
A Combination of Generic Strategies
- Stuck in the Middle?
These generic strategies are not necessarily compatible with one another. If a firm attempts to achieve an advantage on all fronts, in this attempt it may achieve no advantage at all. For example, if a firm differentiates itself by supplying very high quality products, it risks undermining that quality if it seeks to become a cost leader. Even if the quality did not suffer, the firm would risk projecting a confusing image. For this reason, Michael Porter argued that to be successful over the long-term, a firm must select only one of these three generic strategies. Otherwise, with more than one single generic strategy the firm will be "stuck in the middle" and will not achieve a competitive advantage.
Porter argued that firms that are able to succeed at multiple strategies often do so by creating separate business units for each strategy. By separating the strategies into different units having different policies and even different cultures, a corporation is less likely to become "stuck in the middle."
However, there exists a viewpoint that a single generic strategy is not always best because within the same product customers often seek multi-dimensional satisfactions such as a combination of quality, style, convenience, and price. There have been cases in which high quality producers faithfully followed a single strategy and then suffered greatly when another firm entered the market with a lower-quality product that better met the overall needs of the customers.
Generic Strategies and Industry Forces
These generic strategies each have attributes that can serve to defend against competitive forces. The following table compares some characteristics of the generic strategies in the context of the Porter's five forces.
| Industry Force | Generic Strategies | ||
| Cost Leadership | Differentiation | Focus | |
| Entry Barriers | Ability to cut price in retaliation deters potential entrants. | Customer loyalty can discourage potential entrants. | Focusing develops core competencies that can act as an entry barrier. |
| Buyer Power | Ability to offer lower price to powerful buyers. | Large buyers have less power to negotiate because of few close alternatives. | Large buyers have less power to negotiate because of few alternatives. |
| Supplier Power | Better insulated from powerful suppliers. | Better able to pass on supplier price increases to customers. | Suppliers have power because of low volumes, but a differentiation-focused firm is better able to pass on supplier price increases. |
| Threat of Substitutes | Can use low price to defend against substitutes. | Customer's become attached to differentiating attributes, reducing threat of substitutes. | Specialized products & core competency protect against substitutes. |
| Rivalry | Better able to compete on price. | Brand loyalty to keep customers from rivals. | Rivals cannot meet differentiation-focused customer needs. |
Porter's Five Forces
The model of pure competition implies that risk-adjusted rates of return should be constant across firms and industries. However, numerous economic studies have affirmed that different industries can sustain different levels of profitability; part of this difference is explained by industry structure.
Michael Porter provided a framework that models an industry as being influenced by five forces. The strategic business manager seeking to develop an edge over rival firms can use this model to better understand the industry context in which the firm operates.
Diagram of Porter's 5 Forces
| SUPPLIER POWER Supplier concentration Importance of volume to supplier Differentiation of inputs Impact of inputs on cost or differentiation Switching costs of firms in the industry Presence of substitute inputs Threat of forward integration Cost relative to total purchases in industry | ||
| BARRIERS TO ENTRY Absolute cost advantages Proprietary learning curve Access to inputs Government policy Economies of scale Capital requirements Brand identity Switching costs Access to distribution Expected retaliation Proprietary products | 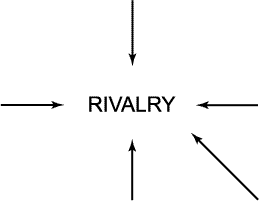 | THREAT OF SUBSTITUTES -Switching costs -Buyer inclination to substitute -Price-performance trade-off of substitutes |
| BUYER POWER Bargaining leverage Buyer volume Buyer information Brand identity Price sensitivity Threat of backward integration Product differentiation Buyer concentration vs. industry Substitutes available Buyers' incentives | DEGREE OF RIVALRY -Exit barriers -Industry concentration -Fixed costs/Value added -Industry growth -Intermittent overcapacity -Product differences -Switching costs -Brand identity -Diversity of rivals -Corporate stakes |
I. Rivalry
In the traditional economic model, competition among rival firms drives profits to zero. But competition is not perfect and firms are not unsophisticated passive price takers. Rather, firms strive for a competitive advantage over their rivals. The intensity of rivalry among firms varies across industries, and strategic analysts are interested in these differences.
Economists measure rivalry by indicators of industry concentration. The Concentration Ratio (CR) is one such measure. The Bureau of Census periodically reports the CR for major Standard Industrial Classifications (SIC's). The CR indicates the percent of market share held by the four largest firms (CR's for the largest 8, 25, and 50 firms in an industry also are available). A high concentration ratio indicates that a high concentration of market share is held by the largest firms - the industry is concentrated. With only a few firms holding a large market share, the competitive landscape is less competitive (closer to a monopoly). A low concentration ratio indicates that the industry is characterized by many rivals, none of which has a significant market share. These fragmented markets are said to be competitive. The concentration ratio is not the only available measure; the trend is to define industries in terms that convey more information than distribution of market share.
If rivalry among firms in an industry is low, the industry is considered to be disciplined. This discipline may result from the industry's history of competition, the role of a leading firm, or informal compliance with a generally understood code of conduct. Explicit collusion generally is illegal and not an option; in low-rivalry industries competitive moves must be constrained informally. However, a maverick firm seeking a competitive advantage can displace the otherwise disciplined market.
When a rival acts in a way that elicits a counter-response by other firms, rivalry intensifies. The intensity of rivalry commonly is referred to as being cutthroat, intense, moderate, or weak, based on the firms' aggressiveness in attempting to gain an advantage.
In pursuing an advantage over its rivals, a firm can choose from several competitive moves:
Changing prices - raising or lowering prices to gain a temporary advantage.
Improving product differentiation - improving features, implementing innovations in the manufacturing process and in the product itself.
Creatively using channels of distribution - using vertical integration or using a distribution channel that is novel to the industry. For example, with high-end jewelry stores reluctant to carry its watches, Timex moved into drugstores and other non-traditional outlets and cornered the low to mid-price watch market.
Exploiting relationships with suppliers - for example, from the 1950's to the 1970's Sears, Roebuck and Co. dominated the retail household appliance market. Sears set high quality standards and required suppliers to meet its demands for product specifications and price.
The intensity of rivalry is influenced by the following industry characteristics:
A larger number of firms increases rivalry because more firms must compete for the same customers and resources. The rivalry intensifies if the firms have similar market share, leading to a struggle for market leadership.
Slow market growth causes firms to fight for market share. In a growing market, firms are able to improve revenues simply because of the expanding market.
High fixed costs result in an economy of scale effect that increases rivalry. When total costs are mostly fixed costs, the firm must produce near capacity to attain the lowest unit costs. Since the firm must sell this large quantity of product, high levels of production lead to a fight for market share and results in increased rivalry.
High storage costs or highly perishable products cause a producer to sell goods as soon as possible. If other producers are attempting to unload at the same time, competition for customers intensifies.
Low switching costs increases rivalry. When a customer can freely switch from one product to another there is a greater struggle to capture customers.
Low levels of product differentiation is associated with higher levels of rivalry. Brand identification, on the other hand, tends to constrain rivalry.
Strategic stakes are high when a firm is losing market position or has potential for great gains. This intensifies rivalry.
High exit barriers place a high cost on abandoning the product. The firm must compete. High exit barriers cause a firm to remain in an industry, even when the venture is not profitable. A common exit barrier is asset specificity. When the plant and equipment required for manufacturing a product is highly specialized, these assets cannot easily be sold to other buyers in another industry. Litton Industries' acquisition of Ingalls Shipbuilding facilities illustrates this concept. Litton was successful in the 1960's with its contracts to build Navy ships. But when the Vietnam war ended, defense spending declined and Litton saw a sudden decline in its earnings. As the firm restructured, divesting from the shipbuilding plant was not feasible since such a large and highly specialized investment could not be sold easily, and Litton was forced to stay in a declining shipbuilding market.
A diversity of rivals with different cultures, histories, and philosophies make an industry unstable. There is greater possibility for mavericks and for misjudging rival's moves. Rivalry is volatile and can be intense. The hospital industry, for example, is populated by hospitals that historically are community or charitable institutions, by hospitals that are associated with religious organizations or universities, and by hospitals that are for-profit enterprises. This mix of philosophies about mission has lead occasionally to fierce local struggles by hospitals over who will get expensive diagnostic and therapeutic services. At other times, local hospitals are highly cooperative with one another on issues such as community disaster planning.
Industry Shakeout. A growing market and the potential for high profits induces new firms to enter a market and incumbent firms to increase production. A point is reached where the industry becomes crowded with competitors, and demand cannot support the new entrants and the resulting increased supply. The industry may become crowded if its growth rate slows and the market becomes saturated, creating a situation of excess capacity with too many goods chasing too few buyers. A shakeout ensues, with intense competition, price wars, and company failures.
BCG founder Bruce Henderson generalized this observation as the Rule of Three and Four: a stable market will not have more than three significant competitors, and the largest competitor will have no more than four times the market share of the smallest. If this rule is true, it implies that:
- If there is a larger number of competitors, a shakeout is inevitable
- Surviving rivals will have to grow faster than the market
- Eventual losers will have a negative cash flow if they attempt to grow
- All except the two largest rivals will be losers
- The definition of what constitutes the "market" is strategically important.
Whatever the merits of this rule for stable markets, it is clear that market stability and changes in supply and demand affect rivalry. Cyclical demand tends to create cutthroat competition. This is true in the disposable diaper industry in which demand fluctuates with birth rates, and in the greeting card industry in which there are more predictable business cycles.
II. Threat Of Substitutes
In Porter's model, substitute products refer to products in other industries. To the economist, a threat of substitutes exists when a product's demand is affected by the price change of a substitute product. A product's price elasticity is affected by substitute products - as more substitutes become available, the demand becomes more elastic since customers have more alternatives. A close substitute product constrains the ability of firms in an industry to raise prices.
The competition engendered by a Threat of Substitute comes from products outside the industry. The price of aluminum beverage cans is constrained by the price of glass bottles, steel cans, and plastic containers. These containers are substitutes, yet they are not rivals in the aluminum can industry. To the manufacturer of automobile tires, tire retreads are a substitute. Today, new tires are not so expensive that car owners give much consideration to retreading old tires. But in the trucking industry new tires are expensive and tires must be replaced often. In the truck tire market, retreading remains a viable substitute industry. In the disposable diaper industry, cloth diapers are a substitute and their prices constrain the price of disposables.
While the treat of substitutes typically impacts an industry through price competition, there can be other concerns in assessing the threat of substitutes. Consider the substitutability of different types of TV transmission: local station transmission to home TV antennas via the airways versus transmission via cable, satellite, and telephone lines. The new technologies available and the changing structure of the entertainment media are contributing to competition among these substitute means of connecting the home to entertainment. Except in remote areas it is unlikely that cable TV could compete with free TV from an aerial without the greater diversity of entertainment that it affords the customer.
III. Buyer Power
The power of buyers is the impact that customers have on a producing industry. In general, when buyer power is strong, the relationship to the producing industry is near to what an economist terms a monopsony - a market in which there are many suppliers and one buyer. Under such market conditions, the buyer sets the price. In reality few pure monopsonies exist, but frequently there is some asymmetry between a producing industry and buyers. The following tables outline some factors that determine buyer power.
| Buyers are Powerful if: | Example |
| Buyers are concentrated - there are a few buyers with significant market share | DOD purchases from defense contractors |
| Buyers purchase a significant proportion of output - distribution of purchases or if the product is standardized | Circuit City and Sears' large retail market provides power over appliance manufacturers |
| Buyers possess a credible backward integration threat - can threaten to buy producing firm or rival | Large auto manufacturers' purchases of tires |
| Buyers are Weak if: | Example |
| Producers threaten forward integration - producer can take over own distribution/retailing | Movie-producing companies have integrated forward to acquire theaters |
| Significant buyer switching costs - products not standardized and buyer cannot easily switch to another product | IBM's 360 system strategy in the 1960's |
| Buyers are fragmented (many, different) - no buyer has any particular influence on product or price | Most consumer products |
| Producers supply critical portions of buyers' input - distribution of purchases | Intel's relationship with PC manufacturers |
IV. Supplier Power
A producing industry requires raw materials - labor, components, and other supplies. This requirement leads to buyer-supplier relationships between the industry and the firms that provide it the raw materials used to create products. Suppliers, if powerful, can exert an influence on the producing industry, such as selling raw materials at a high price to capture some of the industry's profits. The following tables outline some factors that determine supplier power.
| Suppliers are Powerful if: | Example |
| Credible forward integration threat by suppliers | Baxter International, manufacturer of hospital supplies, acquired American Hospital Supply, a distributor |
| Suppliers concentrated | Drug industry's relationship to hospitals |
| Significant cost to switch suppliers | Microsoft's relationship with PC manufacturers |
| Customers Powerful | Boycott of grocery stores selling non-union picked grapes |
| Suppliers are Weak if: | Example |
| Many competitive suppliers - product is standardized | Tire industry relationship to automobile manufacturers |
| Purchase commodity products | Grocery store brand label products |
| Credible backward integration threat by purchasers | Timber producers relationship to paper companies |
| Concentrated purchasers | Garment industry relationship to major department stores |
| Customers Weak | Travel agents' relationship to airlines |
V. Barriers to Entry / Threat of Entry
It is not only incumbent rivals that pose a threat to firms in an industry; the possibility that new firms may enter the industry also affects competition. In theory, any firm should be able to enter and exit a market, and if free entry and exit exists, then profits always should be nominal. In reality, however, industries possess characteristics that protect the high profit levels of firms in the market and inhibit additional rivals from entering the market. These are barriers to entry.
Barriers to entry are more than the normal equilibrium adjustments that markets typically make. For example, when industry profits increase, we would expect additional firms to enter the market to take advantage of the high profit levels, over time driving down profits for all firms in the industry. When profits decrease, we would expect some firms to exit the market thus restoring a market equilibrium. Falling prices, or the expectation that future prices will fall, deters rivals from entering a market. Firms also may be reluctant to enter markets that are extremely uncertain, especially if entering involves expensive start-up costs. These are normal accommodations to market conditions. But if firms individually (collective action would be illegal collusion) keep prices artificially low as a strategy to prevent potential entrants from entering the market, such entry-deterring pricing establishes a barrier.
Barriers to entry are unique industry characteristics that define the industry. Barriers reduce the rate of entry of new firms, thus maintaining a level of profits for those already in the industry. From a strategic perspective, barriers can be created or exploited to enhance a firm's competitive advantage. Barriers to entry arise from several sources:
Government creates barriers. Although the principal role of the government in a market is to preserve competition through anti-trust actions, government also restricts competition through the granting of monopolies and through regulation. Industries such as utilities are considered natural monopolies because it has been more efficient to have one electric company provide power to a locality than to permit many electric companies to compete in a local market. To restrain utilities from exploiting this advantage, government permits a monopoly, but regulates the industry. Illustrative of this kind of barrier to entry is the local cable company. The franchise to a cable provider may be granted by competitive bidding, but once the franchise is awarded by a community a monopoly is created. Local governments were not effective in monitoring price gouging by cable operators, so the federal government has enacted legislation to review and restrict prices.
The regulatory authority of the government in restricting competition is historically evident in the banking industry. Until the 1970's, the markets that banks could enter were limited by state governments. As a result, most banks were local commercial and retail banking facilities. Banks competed through strategies that emphasized simple marketing devices such as awarding toasters to new customers for opening a checking account. When banks were deregulated, banks were permitted to cross state boundaries and expand their markets. Deregulation of banks intensified rivalry and created uncertainty for banks as they attempted to maintain market share. In the late 1970's, the strategy of banks shifted from simple marketing tactics to mergers and geographic expansion as rivals attempted to expand markets.
Patents and proprietary knowledge serve to restrict entry into an industry. Ideas and knowledge that provide competitive advantages are treated as private property when patented, preventing others from using the knowledge and thus creating a barrier to entry. Edwin Land introduced the Polaroid camera in 1947 and held a monopoly in the instant photography industry. In 1975, Kodak attempted to enter the instant camera market and sold a comparable camera. Polaroid sued for patent infringement and won, keeping Kodak out of the instant camera industry.
Asset specificity inhibits entry into an industry. Asset specificity is the extent to which the firm's assets can be utilized to produce a different product. When an industry requires highly specialized technology or plants and equipment, potential entrants are reluctant to commit to acquiring specialized assets that cannot be sold or converted into other uses if the venture fails. Asset specificity provides a barrier to entry for two reasons: First, when firms already hold specialized assets they fiercely resist efforts by others from taking their market share. New entrants can anticipate aggressive rivalry. For example, Kodak had much capital invested in its photographic equipment business and aggressively resisted efforts by Fuji to intrude in its market. These assets are both large and industry specific. The second reason is that potential entrants are reluctant to make investments in highly specialized assets.
Organizational (Internal) Economies of Scale. The most cost efficient level of production is termed Minimum Efficient Scale (MES). This is the point at which unit costs for production are at minimum - i.e., the most cost efficient level of production. If MES for firms in an industry is known, then we can determine the amount of market share necessary for low cost entry or cost parity with rivals. For example, in long distance communications roughly 10% of the market is necessary for MES. If sales for a long distance operator fail to reach 10% of the market, the firm is not competitive.
The existence of such an economy of scale creates a barrier to entry. The greater the difference between industry MES and entry unit costs, the greater the barrier to entry. So industries with high MES deter entry of small, start-up businesses. To operate at less than MES there must be a consideration that permits the firm to sell at a premium price - such as product differentiation or local monopoly.
Barriers to exit work similarly to barriers to entry. Exit barriers limit the ability of a firm to leave the market and can exacerbate rivalry - unable to leave the industry, a firm must compete. Some of an industry's entry and exit barriers can be summarized as follows:
Easy to Enter if there is:
| Difficult to Enter if there is:
|
Easy to Exit if there are:
| Difficult to Exit if there are:
|
DYNAMIC NATURE OF INDUSTRY RIVALRY
Our descriptive and analytic models of industry tend to examine the industry at a given state. The nature and fascination of business is that it is not static. While we are prone to generalize, for example, list GM, Ford, and Chrysler as the "Big 3" and assume their dominance, we also have seen the automobile industry change. Currently, the entertainment and communications industries are in flux. Phone companies, computer firms, and entertainment are merging and forming strategic alliances that re-map the information terrain. Schumpeter and, more recently, Porter have attempted to move the understanding of industry competition from a static economic or industry organization model to an emphasis on the interdependence of forces as dynamic, or punctuated equilibrium, as Porter terms it.
In Schumpeter's and Porter's view the dynamism of markets is driven by innovation. We can envision these forces at work as we examine the following changes:
Top 10 US Industrial Firms by Sales 1917 - 1988
| 1917 | 1945 | 1966 | 1983 | 1988 | |
| 1 | US Steel | General Motors | General Motors | Exxon | General Motors |
| 2 | Swift | US Steel | Ford | General Motors | Ford |
| 3 | Armour | Standard Oil -NJ | Standard Oil -NJ (Exxon) | Mobil | Exxon |
| 4 | American Smelting | US Steel | General Electric | Texaco | IBM |
| 5 | Standard Oil -NJ | Bethlehem Steel | Chrysler | Ford | General Electric |
| 6 | Bethlehem Steel | Swift | Mobil | IBM | Mobil |
| 7 | Ford | Armour | Texaco | Socal (Oil) | Chrysler |
| 8 | DuPont | Curtiss-Wright | US Steel | DuPont | Texaco |
| 9 | American Sugar | Chrysler | IBM | Gulf Oil | DuPont |
| 10 | General Electric | Ford | Gulf Oil | Standard Oil of Indiana | Philip Morris |
10 Largest US Firms by Assets, 1909 and 1987
| 1909 | 1987 | |
| 1 | US STEEL | GM (Not listed in 1909) |
| 2 | STANDARD OIL, NJ (Now, EXXON #3) | SEARS (1909 = 45) |
| 3 | AMERICAN TOBACCO (Now, American Brands #52) | EXXON (Standard Oil trust broken up in 1911) |
| 4 | AMERICAN MERCANTILE MARINE (Renamed US Lines; acquired by Kidde, Inc., 1969; sold to McLean Industries, 1978; bankruptcy, 1986 | IBM (Ranked 68, 1948) |
| 5 | INTERNATIONAL HARVESTER (Renamed Navistar #182); divested farm equipment | FORD (Listed in 1919) |
| 6 | ANACONDA COPPER (acquired by ARCO in 1977) | MOBIL OIL |
| 7 | US LEATHER (Liquidated in 1935) | GENERAL ELECTRIC (1909= 16) |
| 8 | ARMOUR (Merged in 1968 with General Host; in 1969 by Greyhound; 1983 sold to ConAgra) | CHEVRON (Not listed in 1909) |
| 9 | AMERICAN SUGAR REFINING (Renamed AMSTAR. In 1967 =320) Leveraged buyout and sold in pieces) | TEXACO (1909= 91) |
| 10 | PULLMAN, INC (Acquired by Wheelabrator Frye, 1980; spun-off as Pullman-Peabody, 1981; 1984 sold to Trinity Industries) | DU PONT (1909= 29) |
GENERIC STRATEGIES TO COUNTER THE FIVE FORCES
Strategy can be formulated on three levels:
- corporate level
- business unit level
- functional or departmental level.
The business unit level is the primary context of industry rivalry. Michael Porter identified three generic strategies (cost leadership, differentiation, and focus) that can be implemented at the business unit level to create a competitive advantage. The proper generic strategy will position the firm to leverage its strengths and defend against the adverse effects of the five forces.
SWOT Analysis
A scan of the internal and external environment is an important part of the strategic planning process. Environmental factors internal to the firm usually can be classified as strengths (S) or weaknesses (W), and those external to the firm can be classified as opportunities (O) or threats (T). Such an analysis of the strategic environment is referred to as a SWOT analysis.
The SWOT analysis provides information that is helpful in matching the firm's resources and capabilities to the competitive environment in which it operates. As such, it is instrumental in strategy formulation and selection. The following diagram shows how a SWOT analysis fits into an environmental scan:
SWOT Analysis Framework
| ||||||||||||||
Strengths
A firm's strengths are its resources and capabilities that can be used as a basis for developing a competitive advantage. Examples of such strengths include:
- patents
- strong brand names
- good reputation among customers
- cost advantages from proprietary know-how
- exclusive access to high grade natural resources
- favorable access to distribution networks
Weaknesses
The absence of certain strengths may be viewed as a weakness. For example, each of the following may be considered weaknesses:
- lack of patent protection
- a weak brand name
- poor reputation among customers
- high cost structure
- lack of access to the best natural resources
- lack of access to key distribution channels
In some cases, a weakness may be the flip side of a strength. Take the case in which a firm has a large amount of manufacturing capacity. While this capacity may be considered a strength that competitors do not share, it also may be a considered a weakness if the large investment in manufacturing capacity prevents the firm from reacting quickly to changes in the strategic environment.
Opportunities
The external environmental analysis may reveal certain new opportunities for profit and growth. Some examples of such opportunities include:
- an unfulfilled customer need
- arrival of new technologies
- loosening of regulations
- removal of international trade barriers
Threats
Changes in the external environmental also may present threats to the firm. Some examples of such threats include:
- shifts in consumer tastes away from the firm's products
- emergence of substitute products
- new regulations
- increased trade barriers
The SWOT Matrix
A firm should not necessarily pursue the more lucrative opportunities. Rather, it may have a better chance at developing a competitive advantage by identifying a fit between the firm's strengths and upcoming opportunities. In some cases, the firm can overcome a weakness in order to prepare itself to pursue a compelling opportunity.
To develop strategies that take into account the SWOT profile, a matrix of these factors can be constructed. The SWOT matrix (also known as a TOWS Matrix) is shown below:
SWOT / TOWS Matrix
Opportunities | S-O strategies | W-O strategies |
Threats | S-T strategies | W-T strategies |
S-O strategies pursue opportunities that are a good fit to the company's strengths.
W-O strategies overcome weaknesses to pursue opportunities.
S-T strategies identify ways that the firm can use its strengths to reduce its vulnerability to external threats.
W-T strategies establish a defensive plan to prevent the firm's weaknesses from making it highly susceptible to external threats.
Subscribe to:
Posts (Atom)